Showing posts with label spss. Show all posts

SPSS Inc. has been acquired by IBM

AWESOME IBM T40 1.5GHZ 512MB 40GB CDRW/DVD WIFI XP PRO LAPTOPSPSS Inc. has been acquired by IBM. Find more ...

Read more...

Modeling in SPSS

Uncover key insights and use them to solve real business problems, with the Modeling family from SPSS, an IBM Company. Find more ...

Read more...

Harvard Business Review: Make Better Decisions

Harvard Business ReviewTraditionally, decision making in organizations has rarely been the focus of systematic analysis.

That may account for the astounding number of recent poor calls, such as decisions to invest in and securitize subprime mortgage loans or to hedge risk with credit default swaps.

Find more ...

Read more...

Describe and Explore your Data with Bar Graph Using SPSS 16.0

The Statistical Imagination (with Free Computer Applications CD-ROM and Student Version SPSS 9.0)Bar graphs can be simple or very complex, depending on how many variables are included. Bar graph can be used to show the number of cases in particular categories or it can show the score on some continuous variable for different categories.

Procedure for creating a bar graph:
  1. From the menu at the top of the screen click on Graphs, then Bar.
  2. Click on Clustered.
  3. In the Data in chart are section, click on Summaries for groups of cases. Click on Define.
  4. In the Bars represent box, click on Other statistics (e.g., mean).
  5. Click on the continuous variable you are interested in (e.g. confidence in press). This should be appear in the box listed as Mean. This indicates that the mean on the confidence in press for different groups will be displayed.
  6. Click on your first categorical variable (e.g. agegp3). Click on the arrow button to move it into the Category axis box. This variable will appear across the button of your bar graph (X axis).
  7. Click on another categorical variable (e.g. sex) and move it into the Define Clusters by: box. This variable will be represented in the legend.
  8. Click on the Options button. Remove the tick from Display groups defined by missing values. To do this, click once on the box.
  9. Click on OK
The output generated from this procedure is presented below:
Reading the output: The output from this procedure shows a summary of the distribution of scores for the groups that have been requested (i.e. males and females from the different age groups). The graph presented above suggests that females had slightly higher confidence in press than males, and that this difference is more pronounced among the two older age groups. Among the 18 to 35 age group and 36-51 age group the difference in scores between males and females is very small.

Read more...

Describe and Explore your Data with Histogram Using SPSS 16.0

Histogram: Statistics, Information graphics, Frequency (statistics), Bar chart, Categorization, Data binning, Interval, Density estimation, Probability density functionWith SPSS Program, you can describe and explore your data using different types of graphs, such as histogram, bar graphs, scatterplots, boxplots, and line graphs. At the moment, I will explain how to create a histogram. Histogram is used to display the distribution of a single continuous variable, like age and Likert-type scores.

  1. From the menu at the top of the screen, click on Graphs, then on Histogram.
  2. Click on your variable of interest and move it to the Variable box (e.g. age).
  3. Click on Display normal curve. This option will give the distribution of your variable and superimposed over the top, how a normal curve for this distribution would look.
  4. If you want to give your graph a title click on the Titles button and type the desired title in the box (e.g. Histogram of age).
  5. Click on Continue, then OK.
This procedure will generate an output as follows:
Reading the output:
Inspection of the shape of the histogram provide you with the information about the distribution of scores on the continuous variable. In this example, the scores are not reasonably normally distributed, with most scores occurring in the center. However, it is common to find data not normally distributed in the social sciences. This issue is well-discussed in the normality part of statistics books.

Read more...

Join the Review of the New SPSS Program


What's New in SPSS Statistics 17.0: After the release of SPSS 17.0 (SPSS Statistics), SPSS.com offers an invaluable opportunities for the users to join what is called 'a complimentary sneak preview of SPSS Statistics 17.0, recorded on Thursday, September 11, 2008.

SPSS 17.0 offers something for everyone: Improved research and reporting tools; greater accessibility for business users combined with new functionality for statistical programmers; easier enterprise integration, deployment, and management. attendants of this webcast will learn many capabilities of SPSS Statistics 17.0:

The new multiple imputation procedure in SPSS Missing Values that helps you more easily complete datasets for more reliable analysis; an updated Syntax Editor so you can more easily create, test, and correct syntax; improved integration with Microsoft® Office, making it easier to create cleanly formatted reports. Find details ...

Read more...

Checking for Outliers


SPSS Survival Manual by Julie Pallant: Many statistical techniques are sensitive to outliers. The previous techniques that we have talked about under the descriptive section can also be used to check for outliers. However, there is alternative way to assess them.
Procedure for Identifying Outliers:
  1. From the menu at the top of the screen, click on Analyze, then click on Descriptive Statistics, then Explore.
  2. In the Display section, make sure Both is selected. This provides both Statistics and Plots.
  3. Click on your variable (e.g. most important problems in 12 months), and move it into the Dependent list box.
  4. Click on id from your variable list and move into the section Label cases. This will give you the ID number of the outlying case.
  5. Click on the Statistics button. Click on Outliers. Click on Continue.
  6. Click on the Plots button. Click on Histogram. Ask for a Stem and Leaf plot as well.
  7. Click on the Options button. Click on Exclude cases pairwise. Click on Continues and then OK.
The output generated from this analysis as follows:

Reading the Output:
  1. Have a look at the Histogram and check the tails of distribution if there are data points falling away as the extremes.
  2. Inspect the Boxplot whether SPSS identifies outliers. These outliers are displayed as little circles with a ID number attached.
  3. Make sure that the outlier's score is genuine and not an error.
  4. Descriptive table provide you with an indication of how much a problem associated with these outlying cases. The expected value is the 5% Trimmed Mean. SPSS removes the top and bottom 5 per cent of the cases and calculated a new mean value to obtain this Trimmed Mean value. If you compare the original mean and this new trimmed mean, you can see if your more extreme scores are having a lot of influence on the mean. If you find these two mean values are very different, you need to investigate the data points further.
  5. The Extreme values table gives you with the highest and the lowest values recorded for that variable and also provide the ID of the person with that score. It helps to identify the case that has the outlying values. SPSS Survival Manual by Julie Pallant

Read more...

Assessing the Normality of your Data


Many statistical analysis techniques hold the assumption that the distribution of scores on the dependent variable is normal. Normality is described as a symmetrical bell-shaped curve where the greatest frequency of the scores in the middle and with the smaller frequencies toward the extremes. Apart from checking normality of the skewness and kurtosis values, using the Explore option of the Descriptive Statistics menu is another way of doing it.
Procedure for Assessing Normality Using Explore
  1. From the menu at the top of the screen click on Analyze, then click on Descriptive Statistics, then Explore.
  2. Click on the variable/s you are interested in (e.g. total perceived stress). Click on the arrow button to move them in the Dependent List box.
  3. Click on any independent or grouping variables that you wish to split your sample by (e.g. sex).
  4. In the Display section make sure that Both is selected. This displays both the plots and statistics generated.
  5. Click on the Plots button. Under Descriptive click on the Histogram. Click on Normality plots with tests.
  6. Click on Continue.
  7. Click on the Options button. In the Missing Values section click on Exclude cases pairwise.
  8. Click on Continue and then OK.
The output generated from this procedure is shown below.
In the table labeled Descriptives, you are provided with descriptive statistics and other information concerning your variables. In the Test of Normality table above, you are provided with the results of the Kolmogorov-Smirnov statistic. This assesses the normality of the distribution of scores. A non-significant result (Sig value of more than .05) indicates normality. In this case, the Sig. Value is .000 for each group suggests violation of the assumption of normality.

Read more...

Obtaining Descriptive Statistics for Continous Variables

We have talked about the procedure to obtain descriptive statistics for categorical variables. Now, I want to show you the procedure of obtaining descriptive statistics for continuous variables:
  1. From the menu at the top of the screen, click on Analyze, then click on Descriptive Statistics, then Descriptives.
  2. Click on all the continuous variables that you want to obtain descriptive statistics for. Click on the arrow button to move them into the variable box (e.g., age).
  3. Click on the Options button. Click on mean, standard deviation, minimum, maximum, skewness, kurtosis.
  4. Click on Continue, and then OK.
The output generated:

Reading the output:
Regarding the variable age, we have information from 1514 respondents, the range of ages is from 18 to 82 years, with a mean of 45.63 and standard deviation of 17.81 This information might be needed to be included in the method section of a research report to describe the characteristics of the sample.
The skewness value indicates that symmetry of the distribution. Kurtosis on the other hand provides information about the peakedness of the distribution. The value of 0 for skewness and kurtosis will be obtained when the distribution is perfectly normal. While positive skewness value indicates that the scores clustered to the left at the low values, negative skewness value indicates that scores clustered to the right-hand of the graph. While positive kurtosis value indicates that the distribution is rather peaked (clustered in the center) with long thin tails, the negative value indicates that a distribution is relatively flat due to the high number of extreme cases.

Read more...

Descriptive Statistics using SPSS: Categorical Variables

An Introduction to Categorical Data Analysis (Wiley Series in Probability and Statistics)We have talked about descriptive statistics in general. Now, I would like to share with you how to work with categorical variables in terms of obtaining descriptive statistics for categorical variables. When you want to know how many people gave each responses (e.g. how many males and females in your samples), you should use Frequencies analysis. Frequencies is used for categorical data because it does not make any sense asking for means, standard deviations, maximum and minimum, etc. for categorical variables.
The procedure that you need to take for Frequencies analysis using SPSS 16.0 is the following steps:
  1. From the menu at the top of the screen, click on Analyze, then click on Descriptive Statistics, then Frequencies.
  2. Choose and highlight the categorical variables that you want to run for analysis (e.g., sex). Move these variables into the variables box.
  3. Click on the Statistics button. In the Dispersion section, tick Minimum and Maximum. Click on Continue and then OK.
The output you generate from this analysis will look like the following figure:
The output shows that there are 635 males (41.9 per cent) and 880 females (58.0 per cent) in the sample, giving a total of 1515 respondents excluding two samples that had coded mistakenly.
Read more...

Descriptive Statistics using SPSS

Descriptive statistics has several uses. You can perform this statistics after making sure that your data is free from errors. Among these uses are:

1. To describe the characteristics of your sample in the Method section of your report. In studies involving human subjects, it is useful to collect information on the number of people or cases in the sample, the number and the percentage of males and females in the sample, the range and the mean of ages, education level and any other relevant background information.

2. To check your variables for any violation of the assumptions underlying the statistical techniques that you will use to address your research questions. It is important to make sure that your data is not violating any of the assumptions made by a certain statistical tests you use (such as t-test, ANOVA, MANOVA, etc.). These descriptive statistics include the mean, standard deviation, range of scores, skewness and kurtosis.

3. To address specific research questions. Usually you have a certain questions that must be addressed with descriptive statistics, such as the mean of scores.
 
Technorati Tags: , ,

Read more...

Saving a Data File in SPSS

It is very important to save data file when you are working with SPSS. SPSS will not save it for you.

Then, you must do it manually and frequently enough in case thing goes wrong, such as a sudden blackout. How to do it?

Go to the File menu (top left hand corner) and choose Save.

You can also just click on the icon that looks like a floppy disk which appears on the toolbar at the top, left of your screen. Or you can use shortcut by pressing Ctrl + s on your keyboard.

If you are working with a new data and has not been saved, SPSS will ask you to specify a name for the file and to indicate a directory and a folder that it will be stored in. Choose the directory and then type in a file name. SPSS will automatically provide all data file names the extension .sav

Technorati Tags: , , ,

Read more...

Opening an Existing Data File in SPSS

When you open SPSS Program, it displays SPSS Opening Screen.

From the this screen, SPSS asks whether you want to Run the tutorial, Type in data, Run an existing query, Create new query using Database Wizard or Open an existing data source.

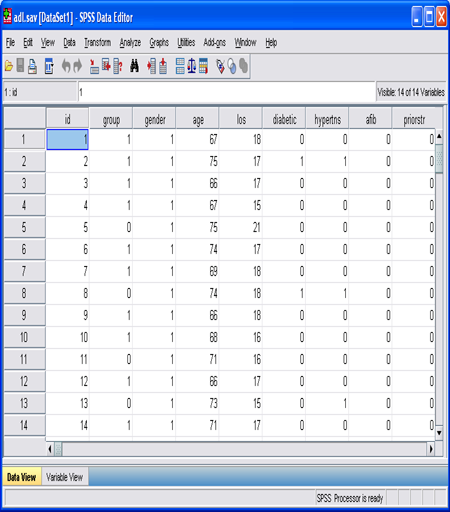
At the moment, we want to talk about how to open an existing data file. If you want to open an existing data file (e.g. one of the files accompanied SPSS tutorials), click on the Opening an existing data source button from the opening screen, then on More Files.

This will take you to search through the various directories on your computer to find where your data file is located. Find the file you want to use and double click on it or click on Open from your Menu. The data file will open in front of you with the Data Editor label.


SPSS for Psychologists, Fourth Edition

Read more...

Now, you can open several windows with SPSS 16.0 at one time.

Unlike the previous versions of SPSS, SPSS 16.0 is more flexible and friendly to users.

When I started learning the usage of SPSS several years ago, the first thing I learned that SPSS did not let you to have more than one data file open at one time. When you want to open one data file while you are working on another data file, SPSS automatically ask you whether you want to save or close the current data file without saving before it lets you to open your new data file.

With SPSS 16.0 you can get several data files open at one time and simply choose from the menu Window to activate the data file you want to work with. It's just like what you do when you work with Microsoft Word Processors.

Technorati Tags: , , , ,

Read more...

About This Blog

Anything related to SPSS and statistics.
We are not statisticians, but we like to share simple things about SPSS and its usage.

The Performance

RSS

  © Blogger templates The Professional Template by Ourblogtemplates.com 2008

Back to TOP