Obtaining Descriptive Statistics for Continous Variables
We have talked about the procedure to obtain descriptive statistics for categorical variables. Now, I want to show you the procedure of obtaining descriptive statistics for continuous variables:
- From the menu at the top of the screen, click on Analyze, then click on Descriptive Statistics, then Descriptives.
- Click on all the continuous variables that you want to obtain descriptive statistics for. Click on the arrow button to move them into the variable box (e.g., age).
- Click on the Options button. Click on mean, standard deviation, minimum, maximum, skewness, kurtosis.
- Click on Continue, and then OK.
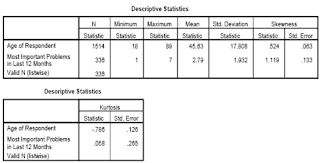
The output generated:

Reading the output:
Regarding the variable age, we have information from 1514 respondents, the range of ages is from 18 to 82 years, with a mean of 45.63 and standard deviation of 17.81 This information might be needed to be included in the method section of a research report to describe the characteristics of the sample.
The skewness value indicates that symmetry of the distribution. Kurtosis on the other hand provides information about the peakedness of the distribution. The value of 0 for skewness and kurtosis will be obtained when the distribution is perfectly normal. While positive skewness value indicates that the scores clustered to the left at the low values, negative skewness value indicates that scores clustered to the right-hand of the graph. While positive kurtosis value indicates that the distribution is rather peaked (clustered in the center) with long thin tails, the negative value indicates that a distribution is relatively flat due to the high number of extreme cases.
0 comments:
Post a Comment