Assessing the Normality of your Data
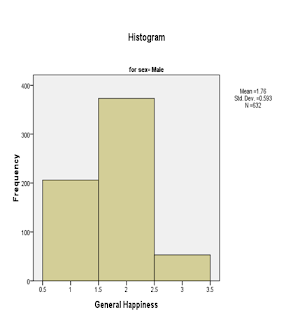
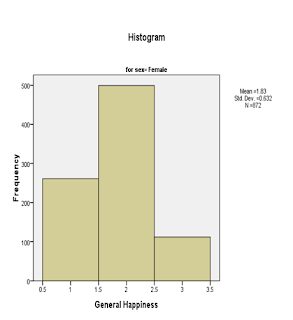
Many statistical analysis techniques hold the assumption that the distribution of scores on the dependent variable is normal. Normality is described as a symmetrical bell-shaped curve where the greatest frequency of the scores in the middle and with the smaller frequencies toward the extremes. Apart from checking normality of the skewness and kurtosis values, using the Explore option of the Descriptive Statistics menu is another way of doing it.
Procedure for Assessing Normality Using Explore

Read more...
- From the menu at the top of the screen click on Analyze, then click on Descriptive Statistics, then Explore.
- Click on the variable/s you are interested in (e.g. total perceived stress). Click on the arrow button to move them in the Dependent List box.
- Click on any independent or grouping variables that you wish to split your sample by (e.g. sex).
- In the Display section make sure that Both is selected. This displays both the plots and statistics generated.
- Click on the Plots button. Under Descriptive click on the Histogram. Click on Normality plots with tests.
- Click on Continue.
- Click on the Options button. In the Missing Values section click on Exclude cases pairwise.
- Click on Continue and then OK.


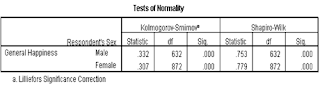
In the table labeled Descriptives, you are provided with descriptive statistics and other information concerning your variables. In the Test of Normality table above, you are provided with the results of the Kolmogorov-Smirnov statistic. This assesses the normality of the distribution of scores. A non-significant result (Sig value of more than .05) indicates normality. In this case, the Sig. Value is .000 for each group suggests violation of the assumption of normality.
