Descriptive Statistics using SPSS: Categorical Variables

The procedure that you need to take for Frequencies analysis using SPSS 16.0 is the following steps:
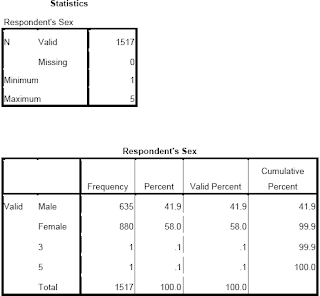 The output shows that there are 635 males (41.9 per cent) and 880 females (58.0 per cent) in the sample, giving a total of 1515 respondents excluding two samples that had coded mistakenly.
- From the menu at the top of the screen, click on Analyze, then click on Descriptive Statistics, then Frequencies.
- Choose and highlight the categorical variables that you want to run for analysis (e.g., sex). Move these variables into the variables box.

- Click on the Statistics button. In the Dispersion section, tick Minimum and Maximum. Click on Continue and then OK.


 The output shows that there are 635 males (41.9 per cent) and 880 females (58.0 per cent) in the sample, giving a total of 1515 respondents excluding two samples that had coded mistakenly.
0 comments:
Post a Comment